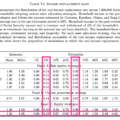
Whether you are a Berkshire Hathaway shareholder or just curious about what Warren Buffett’s “masterpiece” looks like today, here is an interesting graphic from Sherwood News. Essentially, this is the asset allocation of BRK.B, broken down into wholly-owned operating businesses, shares of other publicly-traded companies, and cash (mostly Treasury Bills).
Some may be surprised to find that for every dollar you invest, this asset allocation is 70% into owning businesses and 30% into cash. Those that have tracked its history know that BRK has often had a significant cash pile relative to it’s total market cap. From Bloomberg (paywall):

There is also a bit of fuzziness as they own insurance companies and those insurance companies have roughly between $150 billion and $200 billion of float which can be invested (and considered an interest-free loan if the underwriting breaks even). Of course, this also means that Berkshire must be always be ready to pay out huge claims if certain events unfold.
The most recent discussion has focused on Buffett’s sale of half his Apple shares. I’m not really worried about it. As a shareholder, I have chosen to trust his management. When Buffett bought Apple stock, the P/E ratio was about 16. Today, Apple’s P/E ratio is over 32. Overall, the S&P 500 is also at higher P/E ratios relatively to historical averages. That makes these moves quite reasonable in terms of value investing.
Berkshire Hathaway makes up a very small percentage of my net worth, but remains a pseudo-actively-managed balanced fund with zero expense ratio that I love to watch. There are wholly-owned solid cash-spewing businesses. Shares of other solid cash-spewing businesses bought at fair prices. And just plain cash.


