If you enjoy tinkering with financial calculators, FI Calc is a new one that is visually easy to use and thus potentially more educational. The portfolio inputs are somewhat limited (“stocks” = S&P 500, “bonds” = 10-year US Treasuries) but I enjoy changing up the rest of the variables and seeing how that affects the results. You can support the creator here.
Here’s an example scenario using a 70% stocks/25% bonds/5% cash portfolio (rebalanced annually) along with a 4% withdrawal rate adjusted annually for inflation ($40,000 initially on a $1 million portfolio). The success rate for a 40-year withdrawal period (longer than the usual 30-years) was calculated to be 91.2% (“103 out of 113 retirement simulations were able to sustain withdrawals for the entire retirement.”)
If you scroll down, you can actually see which specific 40-year periods resulted in portfolio successes ? (including big successes ? ) and failures ? (and near failures ?).

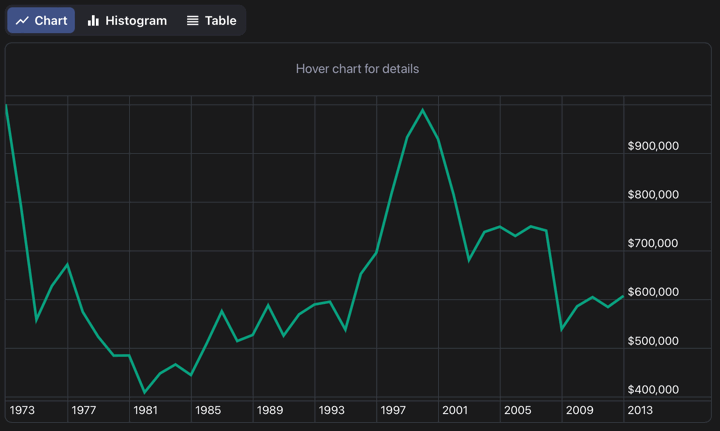
If you click on the 1972-2012 box, you can see how the $1 million portfolio value would have gone down over time, running out of money in 2006.

Yet if you look at the average annual return over that 40-year time period, stocks earned 6.74% real (11.09% nominal) and bonds earned 4.20% real (8.55% nominal). The growth chart for the S&P 500 (shown below) looks great during that same time. It’s just that the “sequence of returns risk” popped up where the returns were low in the beginning of the period and high at the end. If you spend down your portfolio too much in the beginning, it doesn’t have enough money left to come back later.

This also why when people just assume stocks will go up 8% a year, it’s very different than a 8% guaranteed return. The volatility really hurts when you are spending down your assets.
But, when you lower it to a 3.5% withdrawal rate ($35,000 initially on $1 million), your portfolio was able to mount a comeback:


