Remember, the media’s job is to “sell fear”. It drives clicks and eyeballs. It is never as bad as they make it seem.
“Davidson” submits:
Key sentiment indicators continue to improve rising significantly from the June-July historic lows. Three represent institutional level hedging activity, SP500 Net Non-Commercial Futures, $WTI and the 10yr minus T-Bill Rate. The relationship connecting the SP500, SP500 Net Non-Commercial Futures and $WTI is shown in the first two of four charts. Retail investor sentiment is reflected in the fifth chart Retail Money Market Funds The patterns suggest that institutional hedging follows price declines in equities often by several months. Likewise, a rise in equity prices occurs before hedges are eased which shows the influence of market psychology on prices,
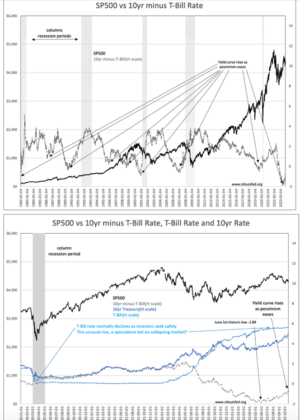
Yield curve inversion (when the 10yr Treasury minus T-Bill Rate is negative) historically occurs as investors turn increasingly optimistic and sell T-Bills to buy longer-term opportunities. Investors historically turn speculative at market peaks which traps investments in illiquid positions forcing panic selling on the next event that shakes market confidence. When investors default on debt, banks rapidly reduce lending and a market correction coincides with an economic correction.
The 10yr Treasury minus T-Bill Rate relationship with the SP500 is in the third chart and T-Bill and 10yr Treasury Rates is shown in the fourth charts. The third chart shows that the rise in speculation near the tops of equity prices is the classic yield curve inversion process. Once equity prices begin to turn lower, investor speculation turns to panic and in the process sell stocks to buy T-Bills which drives the T-Bill rate lower forcing the 10yr Treasury minus T-Bill Rate out of inversion. Investors then reenter equities pushing indices higher and overall market psychology follows. It is Value Investors who begin this turn higher when no one else will buy. It is typical that insiders, the most informed Value Investors, report their highest level of buying during these turns.
COVID in 2020 was one of those events as shown in the fourth chart representing Jan 2020 to Present. T-Bill rates went from 1.55-1.6% pre-COVID to 0.01% in this panic. This was the traditional panic to safe havens that has occurred in every significant correction in market history. However, the pattern of high pessimism and low T-Bill rates did not occur with our recent period of record of intense pessimism following the SP500 top in Dec 2021. What we have seen is a rise in the T-Bill rate from 0.05% Dec 2021 to 5.6% today. This is despite individual investors depositing record sums in Retail Money Funds which should have kept the T-Bill rate rise at least somewhat tempered. It did not.
The unusual T-Bill rate behavior during this period of pessimism, as shown by lower equities, calls for deep recession and record lows, -434.2, in SP500 Net Futures and declines sharp in $WTI, indicates that institutions have added an additional hedge hoping to benefit from the historical pattern of 5yr-10yr rate declines that occur during severe corrections. They have hedged shorting T-Bills/buying 5yr-10yr Treasuries. This drove T-Bill rates higher. This has never occurred during a period of intense pessimism. This has occurred to such a degree that they have overwhelmed the retail capital that has rushed into T-Bills for safety. This interpretation is implied by the record lows of Net Futures and yield curve inversion simultaneously in the 1st week in June.

Currently institutional sentiment indicators continue to improve from the June lows. Retail Money Market Funds are a lagging indicator based entirely on retail market sentiment that trails institutional sentiment.

One of the features of rising institutional sentiment, even though it is itself a lagging indicator, is how it in effect forecasts higher equity prices by where it is relative to prior highs, 200+. As institutional sentiment continues to improve, we can expect higher equity prices to follow over time till Net Futures reflects prior highs. The improvement in the yield curve has a history of lasting 8-10yrs based on recent market cycles. It occurs typically with arise in 10yr Treasury rates as we are seeing today as investors regain confidence in equity returns. The 10yr breached 5% this morning and based on continued inflation is expected to breach 7% the next few years in response to inflation caused by rampant government spending. As investors come to recognize inflation’s threat, I believe they will buy those companies able to pass through inflation cost profitably, i.e. industrials and energy related issues.


