“Davidson” submits:
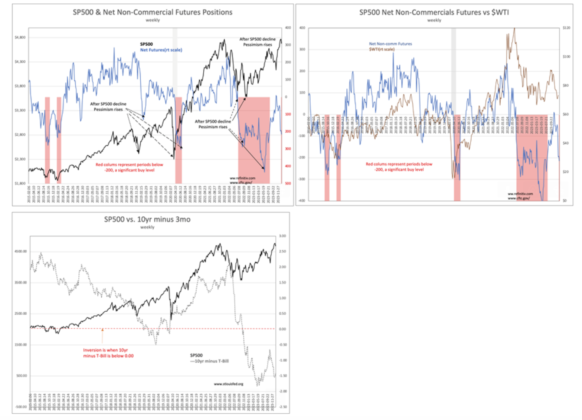
As the SP500 rises almost like clockwork the pessimism follows. All charts are weekly with the first chart shows the SP500 vs Net Non-Commercial Futures. There is a clear pattern of shifts in the SP500 up or down followed by a subsequent and correlated rise or decline in the non-commercial futures positions indicating a rise or fall in optimism. The response to the SP500 always takes a couple months but may take 6mos+. The most recent decline in the SP500 was late Oct 2023 to $4,136 range. It took a rise to $4,793 late Dec 2023 to trigger the period of pessimism shown in the drop this week below -200 (-214.1) which represents a buy signal. $WTI in the second chart followed the same pattern as did the 10yr Treasury minus the 3mo (the Yield Curve Inverted further).
The first chart displays dashed arrows to point out the past delayed futures’ responses to movement in the SP500 but not the most recent pattern. That this delay pattern is more prominent today than 15yrs ago is likely due to the rise in quantity of capital in institutional accounts subject to trading algorithms. Be it as it may, one clear pattern should be obvious, this is a trading pattern that is unconnected to the current economic data which shows employment and economic expansion. What it comes down to in simple terms, large pools of capital are trapped by Modern Portfolio Theory. Being measured on performance quarter-to-quarter, every manager is using mathematical models to not be the last person without a seat when the music stops. It forces’ short-termism’ into trading patterns and this dominates a media seeking daily stories on who is up or down. These managers cannot afford to be long term investors. They cannot select issues on the quality of their management teams. In this politically correct world, one cannot say one prefers one CEO vs another as someone may take public offence and then one will be shunned by the media for saying so. One’s media image is at times more important for growing assets than performance. One is forced to accept the phrase “…the market tells us…” when speaking about the economy and making forecasts. There is no support in our very long market price history of prices being predictive of future prices.
The only predictive of market prices long term has been a combination of Employment, Real Personal Income and Real Retail Sales. The only predictive of individual company performance long term is the past performance of the management team. Especially important in assessing management is how they responded to past unexpected challenges. Today, the fundamentals remain in uptrends since Apr 2020 and better than that are approaching normalization with trends from the last major financially induced recession in 2008-2009. Another 2yr-3yrs of economic expansion appears likely during which in markets past has always led to higher equity prices once the body of quarter-to-quarter investors climbs on board.


