As with most of my posts, I’ll start with the small print first. I don’t know for sure what is going to happen in the next month, but I am preparing my positions and watching these particular levels for a quick drop in the next week or two. While I have heard about September being a bearish month, the strength of this move down, and even the close on Friday, now portends a lower target during the month of October.
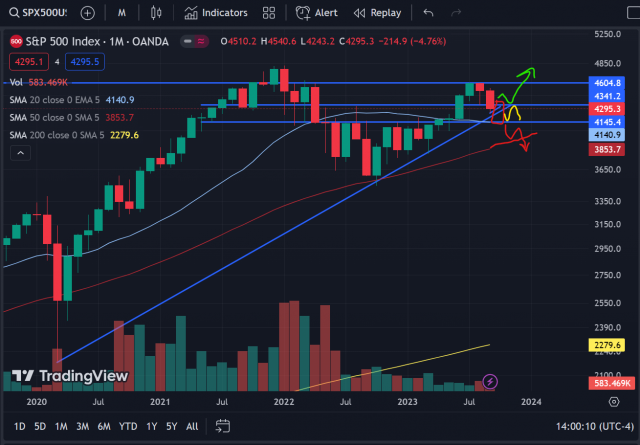
Being in the 4th quarter, everyone is now positioning for the next big move. A bearish September after such a bullish run all year is not too much of a surprise, but the size of the move is what really counts here. While August was a red month, the August close with large lower wick was a bullish thrust which should have at least lent more support into September. However, this latest monthly candle broke beneath and closed beneath the August lows.
Even the last few days of the month when the “window dressing” usually occurs, this could not get off the mat to close above 4300. While there is a lot of news which could send this market popping or dropping in the short-term, the behavior of the market is what I want to nail down and interpret here. And this latest candle says investors are getting shaky and may want to take further profits if they had held since January. The big support level on the Monthly chart is 4150-4200 (this is a wide zone, I know). The 4200 area is considered support mainly because it is the next big round number. However, this also lines up with the ascending trendline drawn from Covid lows in 2020 through March 2023 lows (I am ignoring the October 2022 lows simply because it really didn’t spend much time down there at all, so considering this move a bit extreme).
The key level of resistance is 4337 (August lows). This was important resistance in the past week that was slammed back down on Friday. But I can see a pop up to this level one more time this week before turning back down again. If this is a near-term low, then I doubt we escape without testing that trendline. However, I am really watching 4150 as a potential October low. That 20 Month Average was such an important technical indicator when it acted as resistance for almost an entire year that now we are dropping with ferocity it looks like it is aiming for that retest.
You will notice I drew three potential paths. These all depend on those key levels and whether they break or hold. A bullish break above 4340 (green) would indeed break my bearish thesis once more and could indicate another near-term bottom. I’d look at the September open as short-term resistance, but eventually this would simply be temporary until we break through to close the year near highs. I don’t have a lot of faith in this scenario as there is a lot of momentum downward and not a lot of catalysts to reverse us back up that sharply from what I can see.
The support level of 4150 is key. Should October test that level and start showing further bearishness (i.e., another big red close on monthly chart), then the last two months of the year have potential to really turn down. This would be a tremendous failure of a bullish breakout on a monthly chart. I see this as the second most likely path (but rather close to the primary scenario). Should the resistance and support levels hold, then we might see some consolidation until December. I see this as the most likely (by a smidge). The break of 4200 needs to occur first for the red line scenario to occur, and it is entirely possible we see a bounce start to take place there. There is a lot of confluence of technical support in that area, so we will have to wait and see.
I tried to draw lines at the last important resistance and support tests to emphasize how important these levels are. I also drew the potential paths as indicated on the monthly chart. I am preparing my next week for a test back up to 4340 (I always give a little leeway of about 10 handles or so). But looking for that to reject and turn down. If that fails to hold, then I expect we see a pop and drop to retest yet again, but should solidify support at that area for a while and turn up. If that holds, then we should see a swift drop to 4200. That would test this big round number, suck in a lot of retail shorts, and send the bulls into bit of a scare.
However, this being the 200 Day MA and test of the ascending trendline, I’d prepare my positions and take some profits there in case a bounce indeed does occur. We could end up ping-ponging for the first two weeks of October before we finally break (either the 4340 resistance or ascending trendline. This would basically make an ascending triangle. Note, however, that ascending triangles are really more bullish if they occur after a big up move.
In contrast, if this transpires as I laid out then this will be happening after a big down move, so I’d look for the break. Lastly, obviously, is if this breaks immediately then we could really see some big selling come in to take us down immediately to 4150 (again, give it 10 points or so) before we see buyers step back in.
As for particular stocks, I don’t have anything to add right now that I haven’t mentioned in previous posts. I suppose I’ll mention that BCRX is screwing with me, but still looks like it has tremendous resistance at $8 and could turn down, but really needs to break beneath $7 to pick up some speed to the downside. SE didn’t work out, but losses are minimized as long as you stick to the stops. PLUG still has tremendous potential as a short. SQ dropped from about $57 to $44 since I mentioned it and I think it could head at least towards $30 before it is done (I think it breaks, but we’ll see).
So that’s it for me. I know when I lay out these paths, it may be seen as a ploy so that I can look back and say “hey! I am always right!”… and you’re right. But in reality, it is just the different scenarios I see the potential for and what I am preparing my account/portfolio, and that is all I really care about. If I see levels breaking then obviously the other paths I laid out are wrong, so I will focus on that path, and so on and so forth. So here is my plan for the next week. I hope it helps you all in your trading in the coming weeks.
Spooktacular October Ahead (by Xerxes)


