- The Kiwi is the worst-performing currency among the majors where it depreciated by -7.1% against the USD on a rolling one-month basis.
- RBNZ Is expected to maintain its OCR at 5.50% since the last interest hike in May.
- Watch the key medium-term support of 0.5900/5860 where the downside momentum of NZD/USD may start to pause after declining for six months.
New Zealand central bank, RBNZ will announce its latest monetary policy decision today at 0200 GMT followed by a press conference one hour later. The consensus is calling for another round of pause to its interest rate hiking cycle to maintain the official cash rate (OCR) at 5.50% since its last 25 basis points (bps) hike that was implemented in May. So far, the RNBZ has raised borrowing costs by a total of 525 bps since October 2021.
Also, the RBNZ will release their latest OCR track today which likely shows they will remain on hold into 2024 and the in the previous May meeting, the forecasted path of the OCR was to remain at 5.50% until August 2024 when the first interest rate cut would be enacted.
So far, the Kiwi has come under downside pressure in the past month where it depreciated by -7.10% against the USD, making it the worst-performing currency among the majors based on a rolling one-month basis. The current bout of weakness seen in the NZD/USD has been primarily driven by weak external demand and jitters over China’s ongoing deflationary risk.
Approaching the lower boundary of medium-term “Expanding Wedge”
Fig 1: NZD/USD medium-term trend as of 16 Aug 2023 (Source: TradingView, click to enlarge chart)
Since its 2 February 2023 high of 0.6538, the price actions of NZD/USD have been oscillating within a medium-term “Expanding Wedge” configuration.
Its recent 4-week of impulsive minor down move sequence has it towards key medium-term support of 0.5900/5860 (the lower boundary of the “Expanding Wedge”, 61.8% Fibonacci retracement of the prior medium-term up move from 13 October 2022 low to 2 February 2023 high & 1.00 Fibonacci extension from of the on-going medium-term down move from 2 February 2023 high).
Short-term downside momentum remains intact
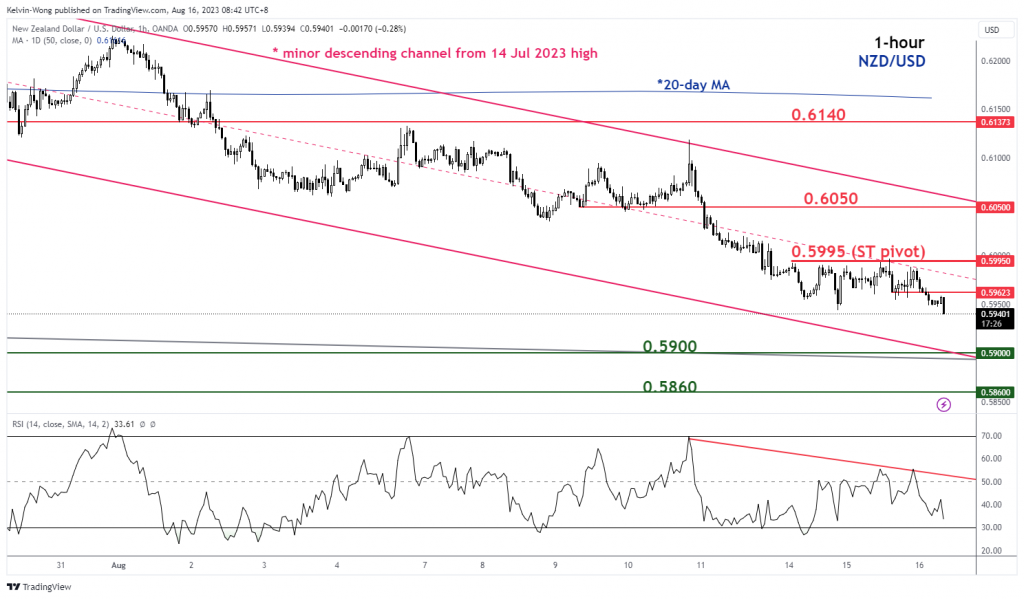
Fig 2: NZD/USD minor short-term trend as of 16 Aug 2023 (Source: TradingView, click to enlarge chart)
Short-term price actions of the NZD/USD have drifted lower within a minor descending channel in place since the 14 July 2023 high.
Watch the 0.5995 key short-term pivotal resistance to maintain the bearish bias for the next supports to come in at 0.5900 and 0.5860 before price actions start to shape a potential consolidation after six months of down move.
However, a clearance above 0.5995 negates the bearish tone to expose the next intermediate resistance at 0.6050 (also the upper boundary of the minor descending channel).
Content is for general information purposes only. It is not investment advice or a solution to buy or sell securities. Opinions are the authors; not necessarily that of OANDA Business Information & Services, Inc. or any of its affiliates, subsidiaries, officers or directors. If you would like to reproduce or redistribute any of the content found on MarketPulse, an award winning forex, commodities and global indices analysis and news site service produced by OANDA Business Information & Services, Inc., please access the RSS feed or contact us at info@marketpulse.com. Visit https://www.marketpulse.com/ to find out more about the beat of the global markets. © 2023 OANDA Business Information & Services Inc.


