– by New Deal democrat
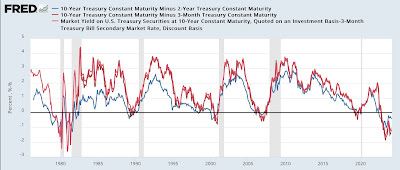
Prof. Menzie Chinn at Econbrowser makes the point that the yield curve is still inverted, and has not yet eclipsed the longest previous time between onset of such an inversion and a recession. So he believes the threat of recession is still on the table.
And he’s correct about the yield curve, although it is getting very long in the tooth. In the past half century, the shortest time between a 10 minus 2 year inversion (blue in the graph below) to recession has been 10 months (1980) and the longest 22 months (2007). For the 10 year minus 3 month inversion (red), the shortest time has been 8 months (1980 and 2001) and the longest has been 17 months (2007):
At present the former yield curve has been inverted for 20.5 months, and the latter for 16.5 months. So if there is no recession by May 1, we’re in uncharted territory as far as the yield curve indicator is concerned.
My view for the past half year or so has been much more cautious. While there has been nearly unprecedented Fed tightening (only the 1980-81 tightening was more severe), on the other hand there was massive pandemic stimulus, and what I described on some occasions as a “hurricane force tailwind” of supply chain unkinking. If the two positive forces have abated, does the negative force of the Fed tightening, which is still in place, now take precedence? Or because interest rates have plateaued in the past year, is it too something of a spent force? Since I confess not to know, because the situation is unprecedented in the modern era for which most data is available, I have highlighted turning to the short leading metrics. Do they remain steady or improve? Or do they deteriorate as they have before prior recessions?
First of all, let me show the NY Fed’s Global Supply Chain Index, which attempts to disaggregate supply sided information from demand side information. A positive value shows relative tightening, a negative loosening:
You can see the huge pandemic tightening in 2020 into 2022, followed by a similarly large loosening through 2023. For the past few months, the Index has been close to neutral, or shown very slight tightness.
Typically in the past Fed tightenings have operated through two main channels: housing and manufacturing, especially durable goods manufacturing.
Let’s take the two in reverse order.
Manufacturing has at very least stalled, and by some measures turned down to recessionary levels. Last week I discussed industrial production (not shown), which peaked in late 2022 and has continued to trend sideways to slightly negative right through February.
A very good harbinger with a record going back 75 years has been the ISM manufacturing index. Here’s its historical record through about 10 years ago (when FRED discontinued publishing it):
And here is its record for the past several years:
This index was frankly recessionary for almost all of last year. It is still negative, although not so much as before.
Two other metrics with lengthy records are the average hourly workweek in manufacturing (blue, right scale), which is one of the 10 “official” leading indicators, as well as real spending on durable goods (red, measured YoY for ease of comparison, left scale):
As a general rule, if real spending on durable goods turns negative YoY for more than an isolated month, a recession has started (with the peak in absolute terms coming before). Also, since employers generally cut hours before cutting jobs, a decline of about 0.8% of an hour in the average manufacturing workweek has typically preceded a recession – with the caveat in modern times that it must fall to at least roughly 40.5 hours:
The average manufacturing workweek has met the former criteria for the last 9 months, and the latter since November. By contrast, real spending on durable goods was up 0.7% YoY as of the last report for January, and in December had made an all-time record high.
But if some of the manufacturing data has met the historical criteria for a recession warning, it is important to note that manufacturing is less of US GDP than before the year 2000, and had been down more in 2015-16 without a recession occurring.
Further, housing construction has not meaningfully constricted at all. The below graph shows the leading metric of housing permits (another “official” component of the LEI, right scale), together with housing units under construction (gold, *1.2 for scale, right scale), and also real GDP q/q (red, left scale):
Housing permits declined -30% after the Fed began tightening, which has normally been enough to trigger a recession. *BUT* the actual measure of economic activity, housing units under construction, has barely turned down at all. In comparison to past downturns, where typically it had fallen at least 10%, and more often 20%, before a recession had begun, as of last month it was only 2% off peak!
The only other two occasions where housing permits declined comparably with no recession ensuing – 1966 and 1986 – real gross domestic product increased robustly. This was similarly the case in 2023.
An important reason is the other historical reason proppin up expansions: stimulative government spending. Here’s the historical record comparing fiscal surpluses vs. deficits:
Note the abrupt end of stimulative spending in 1937, normally thought to have been the prime driver of the steep 1938 recession. Note also the big “Great Society” stimulative spending in 1966-68, when a downturn was averted (indeed, although not shown in the first graph above, there was an inverted yield curve then as well). Needless to say, there as been a great deal of stimulative fiscal spending since 2020 as well.
Fed tightening typically works by constricting demand. Both government stimulus and the unkinking of supply chains work to stimulate supply.
All of which leads to the conclusion that, while manufacturing has reacted to the tightening, the *real* measure of construction activity has not, or not sufficiently to be recessionary.
Tomorrow housing permits, starts, and units under construction will all be updated. Unless there is a sharp decline in units under construction, there is no short-term recession signal at all.
Good news and bad news Thursday: the good news is jobless claims . . . Angry Bear, by New Deal democrat.


