US Dollar, Japanese Yen, USD/JPY, Bank of Japan – Talking Points:
- BOJ kept negative rates on hold.
- ?JGB 10-year yield target and band maintained.
- What is the outlook for USD/JPY and what are the signposts to watch?
Recommended by Manish Jaradi
How to Trade USD/JPY
The Japanese yen tumbled against the US dollar after the Bank of Japan (BOJ) kept its ultra-loose policy settings and maintained the target around 0% and the cap of 1.0% for the 10-year bond yield.
The Japanese central bank was widely expected to keep its policy settings unchanged at the two-day meeting as policymakers wait for more evidence of sustained price pressures. Markets are now focusing on Governor Kazuo Ueda’s briefing for any cues on the timing of the policy shift. In a recent interview, Ueda said the central bank would have enough information and data by the year-end on prices to assess whether to end negative rates, raising speculation of an early exit from current policy settings.
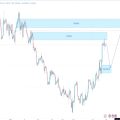
USD/JPY 5-Minute Chart
Chart Created Using TradingView
With inflation continuing to stay well above the central bank’s target, it could be a matter of time before BOJ removes its foot off the ultra-loose monetary pedal. Data released earlier Friday showed Japan’s core inflation rose to 3.1% on-year in August, higher than the 3.0% expected, staying above BOJ’s 2% target. Many in the market believe the BOJ will end its negative interest rates policy next year.
Japan Core Inflation and JGB 10-Year Yield
Sourcedata: Bloomberg; chart created in Microsoft Excel
The central bank’s move in July allowing greater flexibility for long-term rates to move was seen as a step closer toward an exit from the current policy settings. See “Japanese Yen Drops as BOJ Keeps Policy Unchanged: What’s Next for USD/JPY?” published July 28. Since then, the Japan 10-year government bond yield has risen to a fresh-decade high, catching up with rising yields globally as central banks maintain hawkishness amid stubbornly high price pressures.
USD/JPY Weekly Chart
Chart Created Using TradingView
The divergence in monetary policy between Japan and its peers has pushed USD/JPY toward the three-decade high of 152.00 hit in 2022, within the territory that invited intervention in the currency market last year, prompting verbal intervention by Japanese authorities recently. While any intervention could put brakes on JPY’s weakness, for a more sustainable strength in JPY an exit from ultra-loose policy settings by Japan and/or a step back from hawkishness by its peers would be required.
USD/JPY 240-Minute Chart
Chart Created Using TradingView
On technical charts, while the uptrend has slowed in recent weeks, it is by no means over. Even on intraday charts, USD/JPY continues to hold above vital support levels. For instance, on the 240-minute charts, USD/JPY has been trending above the 200-period moving average since July. A break below the moving average, which coincides with the mid-September low of 146.00 would be a warning sign that the two-month-long uptrend was changing. A fall below the early-September low of 144.50 would put the bullish bias at risk.
On the upside, USD/JPY is approaching a stiff ceiling at the 2022 high of 152.00. Above 152.00, the next level to watch would be the 1990 high of 160.35.
Recommended by Manish Jaradi
The Fundamentals of Trend Trading
— Written by Manish Jaradi, Strategist for DailyFX.com
— Contact and follow Jaradi on Twitter: @JaradiManish


