Bitcoin has been having a bad time recently, but this analyst isn’t too worried about it, based on the recent trend in an on-chain indicator.
Bitcoin Unrealized Loss Has Been At Low Levels Recently
In a new post on X, on-chain analyst Checkmate talked about how the latest price action of the cryptocurrency isn’t too scary when considering the trend in the Unrealized Loss.
The “Unrealized Loss” here refers to an on-chain indicator that keeps track of the total loss that addresses across the Bitcoin network are holding right now.
This metric works by going through the transaction history of each coin in circulation to see what price it was last moved at. Assuming that this latest transaction was the last point at which the coin changed hands, the price at its time would reflect its current cost basis.
If this cost basis is higher than the current spot price of the cryptocurrency for any coin, then that particular coin can be considered to hold a net unrealized loss currently.
The Unrealized Loss subtracts the two values to calculate the magnitude of loss for every coin and then sums them up. Naturally, coins of the opposite type contribute towards the “Unrealized Profit” metric instead.
In the context of the current discussion, the Unrealized Loss itself isn’t of interest, but rather a normalized form called the Relative Unrealized Loss. This metric divides the Unrealized Loss by the asset’s market cap.
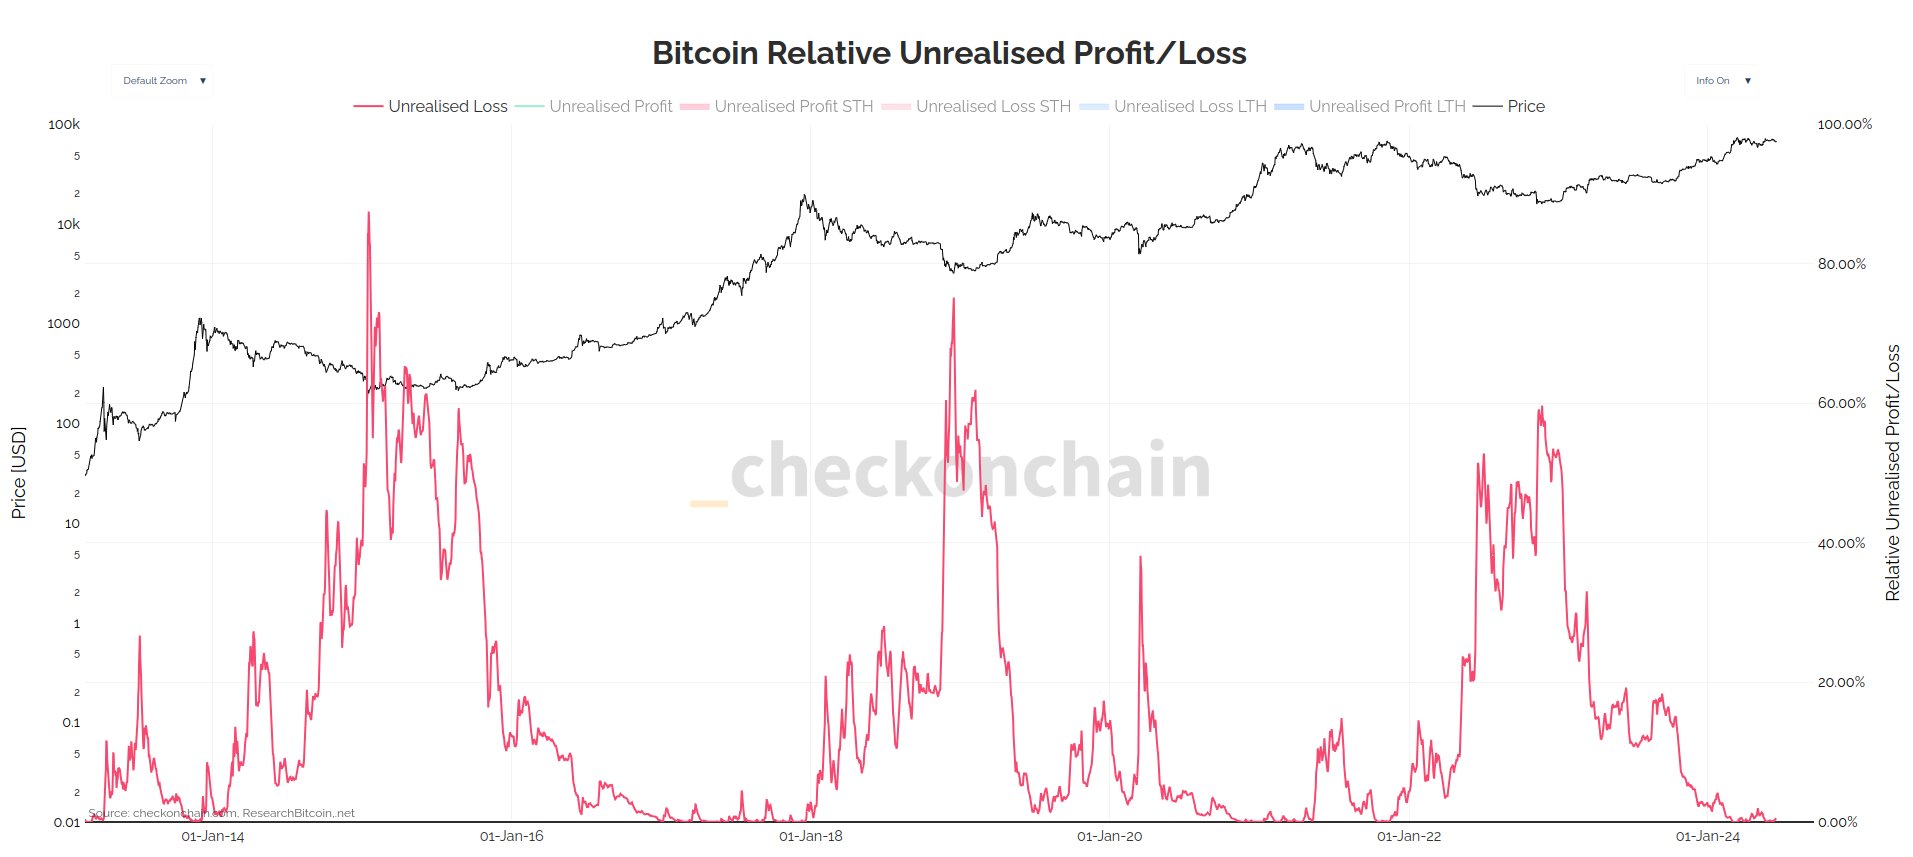
Below is a chart showing this Bitcoin indicator’s trend over the past decade or so.
As is visible in the graph, the Bitcoin Relative Unrealized Loss peaked during the November 2022 bear market lows and has since been heading down. Recently, the metric’s value has been close to zero, implying the losses in the market have only been equal to a negligible percentage of the market cap.
The reason behind these lows is the recent price surge towards the new all-time high (ATH). The entire supply becomes profitable during ATH breaks, so the Unrealized Loss shrinks to zero.
The indicator naturally also fell to zero earlier in the year when the ATH took place, but the bearish price action since then has meant that some of the investors have gone back into losses.
Interestingly, though, the indicator’s value has still been extremely low, implying that while some buying has occurred at the higher prices, it hasn’t been excessive.
From the chart, it’s visible that spikes followed bull market tops in the past in the indicator, as only a small drop was enough to put all the latecomers chasing hype into a loss. That hasn’t been the case in the current cycle so far.
“It is hard for me to be too scared of Bitcoin price action when unrealized losses look like this,” notes Checkmate. The analyst also cautions that it could deteriorate from here, but it hasn’t happened yet.
BTC Price
Bitcoin has continued its recent bearish momentum during the past day as its price has now slipped to $64,500.


