“Davidson” submits:
It has long been assumed and taught that the Federal Reserve sets interest rates. It is said the Fed has a two-fold mandate to 1) maximize employment while 2) minimizing inflation. The discussion of what the Fed will do next with Fed Funds is one of the endless focal points for the media with countdowns for each potential shift and a host of pundits providing opinion and their reasoning. Much of the media reporting on the Fed has the feel of gladiators in a Roman Coliseum. The focus as it is played-up certainly does draw viewership and sell advertising. Does this focus truly matter?
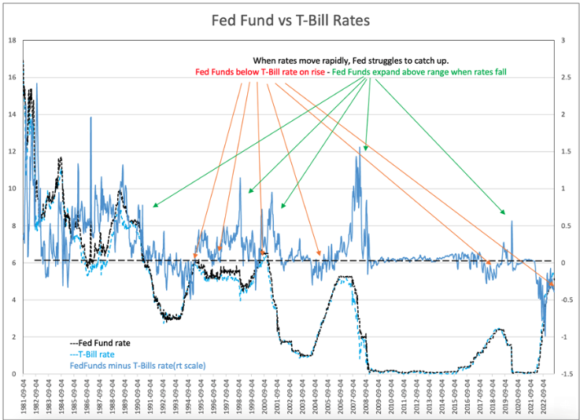
Fed Funds vs T-Bill Rates chart is end-of-week data from Sept 1981-Present. It is designed to show the relative change in the Fed Funds rate with respect to changes in the T-Bill rate during periods when T-Bill rates are changing rapidly. The long-term stated goal of the Fed with regards to market rates is to keep the Fed Funds rate higher than that of T-Bills, the short-term market rate. The Fed does not want to be the cheapest lender to distressed companies and keeps its rate higher than that of the current T-Bill rate by an amount to force the market to deal with its own mistakes rather than seek government bailouts. The Light Blue Line is the record of the current Fed Funds rate minus the T-Bill rate and plotted against the right-hand scale. The history of Fed Funds rate is the Dashed Black Line and the same for T-Bill rate is the Dashed Turquoise Blue Line. In line with the Fed’s long-stated philosophy, the chart mostly shows Fed Funds minus T-Bill rates is above the zero line, highlighted as a Dashed Benchmark at 0% on the right-hand scale. It is the volatility of the difference between Fed Funds and T-Bills that stands in stark to the commonly held belief that the Fed controls interest rates. Net/net the Fed follows, it does not lead rate changes.
There are two complementary features on interest. The first is when rates are rising, Red Arrows. Fed lags in raising its rate which creates a negative rate spread. i.e., the Light Blue Line falls below 0%. The second feature is when rates are falling, Green Arrows. The reverse occurs. The Fed lags in following rates lower and the rate spread widens markedly. The Fed always lags as it works to normalize its position as the more expensive lender. Even with the recent rise in the Fed Fund rate to 5.33%, the T-Bill rate at constant maturity quoted on an investment basis is 5.52%. The Fed remains behind where it has desired the Fed Fund rate historically. If the Fed is leading rates, the patterns in T-Bill rates vs Fed Funds rates should be reverse what the pattern shown. The Fed follows. It does not lead.
The conclusion is the obsession with what the Fed does is better spent on economic analysis where the better signals lay in my opinion.


