
- Chainlink on exchanges climbed to 230.43 million on Friday, up nearly 9% in a single day, per Santiment data.
- LINK tokens flooded exchanges as holders rushed to take profits, realize over $150 million gains.
- LINK whales with 10 million and 100 million tokens distributed their holdings while smaller cohorts accumulated.
Chainlink (LINK) supply on exchanges climbed to 230.43 million on June 21, a massive spike in a 24 hour period. Typically, an increase in the asset’s supply has a negative impact on price as it increases the selling pressure.
Whales holding between 10 million and 100 million LINK distributed their holdings, in the same timeframe, likely realizing profits.
LINK whales take profits, distribute their holdings on Friday
Data from crypto intelligence tracker Santiment shows that the supply of LINK on exchanges climbed nearly 9% in a single day, on June 21. The massive increase in supply was accompanied by a spike in profit taking by LINK holders, as noted by the Network Realized Profit/Loss metric.
The NPL metric is used to identify the net profit/loss of all tokens sold on a given day. It shows a large positive spike on Friday, June 21, as seen in the chart below. This implies that traders flooded exchanges with LINK to take profits.
LINK supply on exchanges and NPL
Whale activity in the same timeframe reveals key insights. The larger cohort that holds between 10 and 100 million LINK distributed their holdings and likely took profits while smaller cohorts holding between 100,000 to 1 million and 1 million to 10 million LINK accumulated the altcoin.
Whale activity supports the narrative of mass profit taking and a bearish thesis for LINK in case the profit taking continues and exchange supply rises.
 [21.28.06, 22 Jun, 2024]-638546697468561743.png)
LINK supply distribution by whale cohorts
LINK could extend losses by 6%
Chainlink is in a downward trend that started on March 11. LINK could extend its losses if the altcoin fails to see a daily candlestick close above the upper boundary of the nearest Fair Value Gap (FVG) at $14.192.
LINK could dip to support at $12.931, this level coincides with the June 18 low for the altcoin. The move marks a 6% drop in Chainlink price.
Momentum indicator, Moving Average Convergence Divergence (MACD) supports the bearish thesis. It presents red histogram bars below the neutral line, a sign of underlying negative momentum in Chainlink’s price trend.
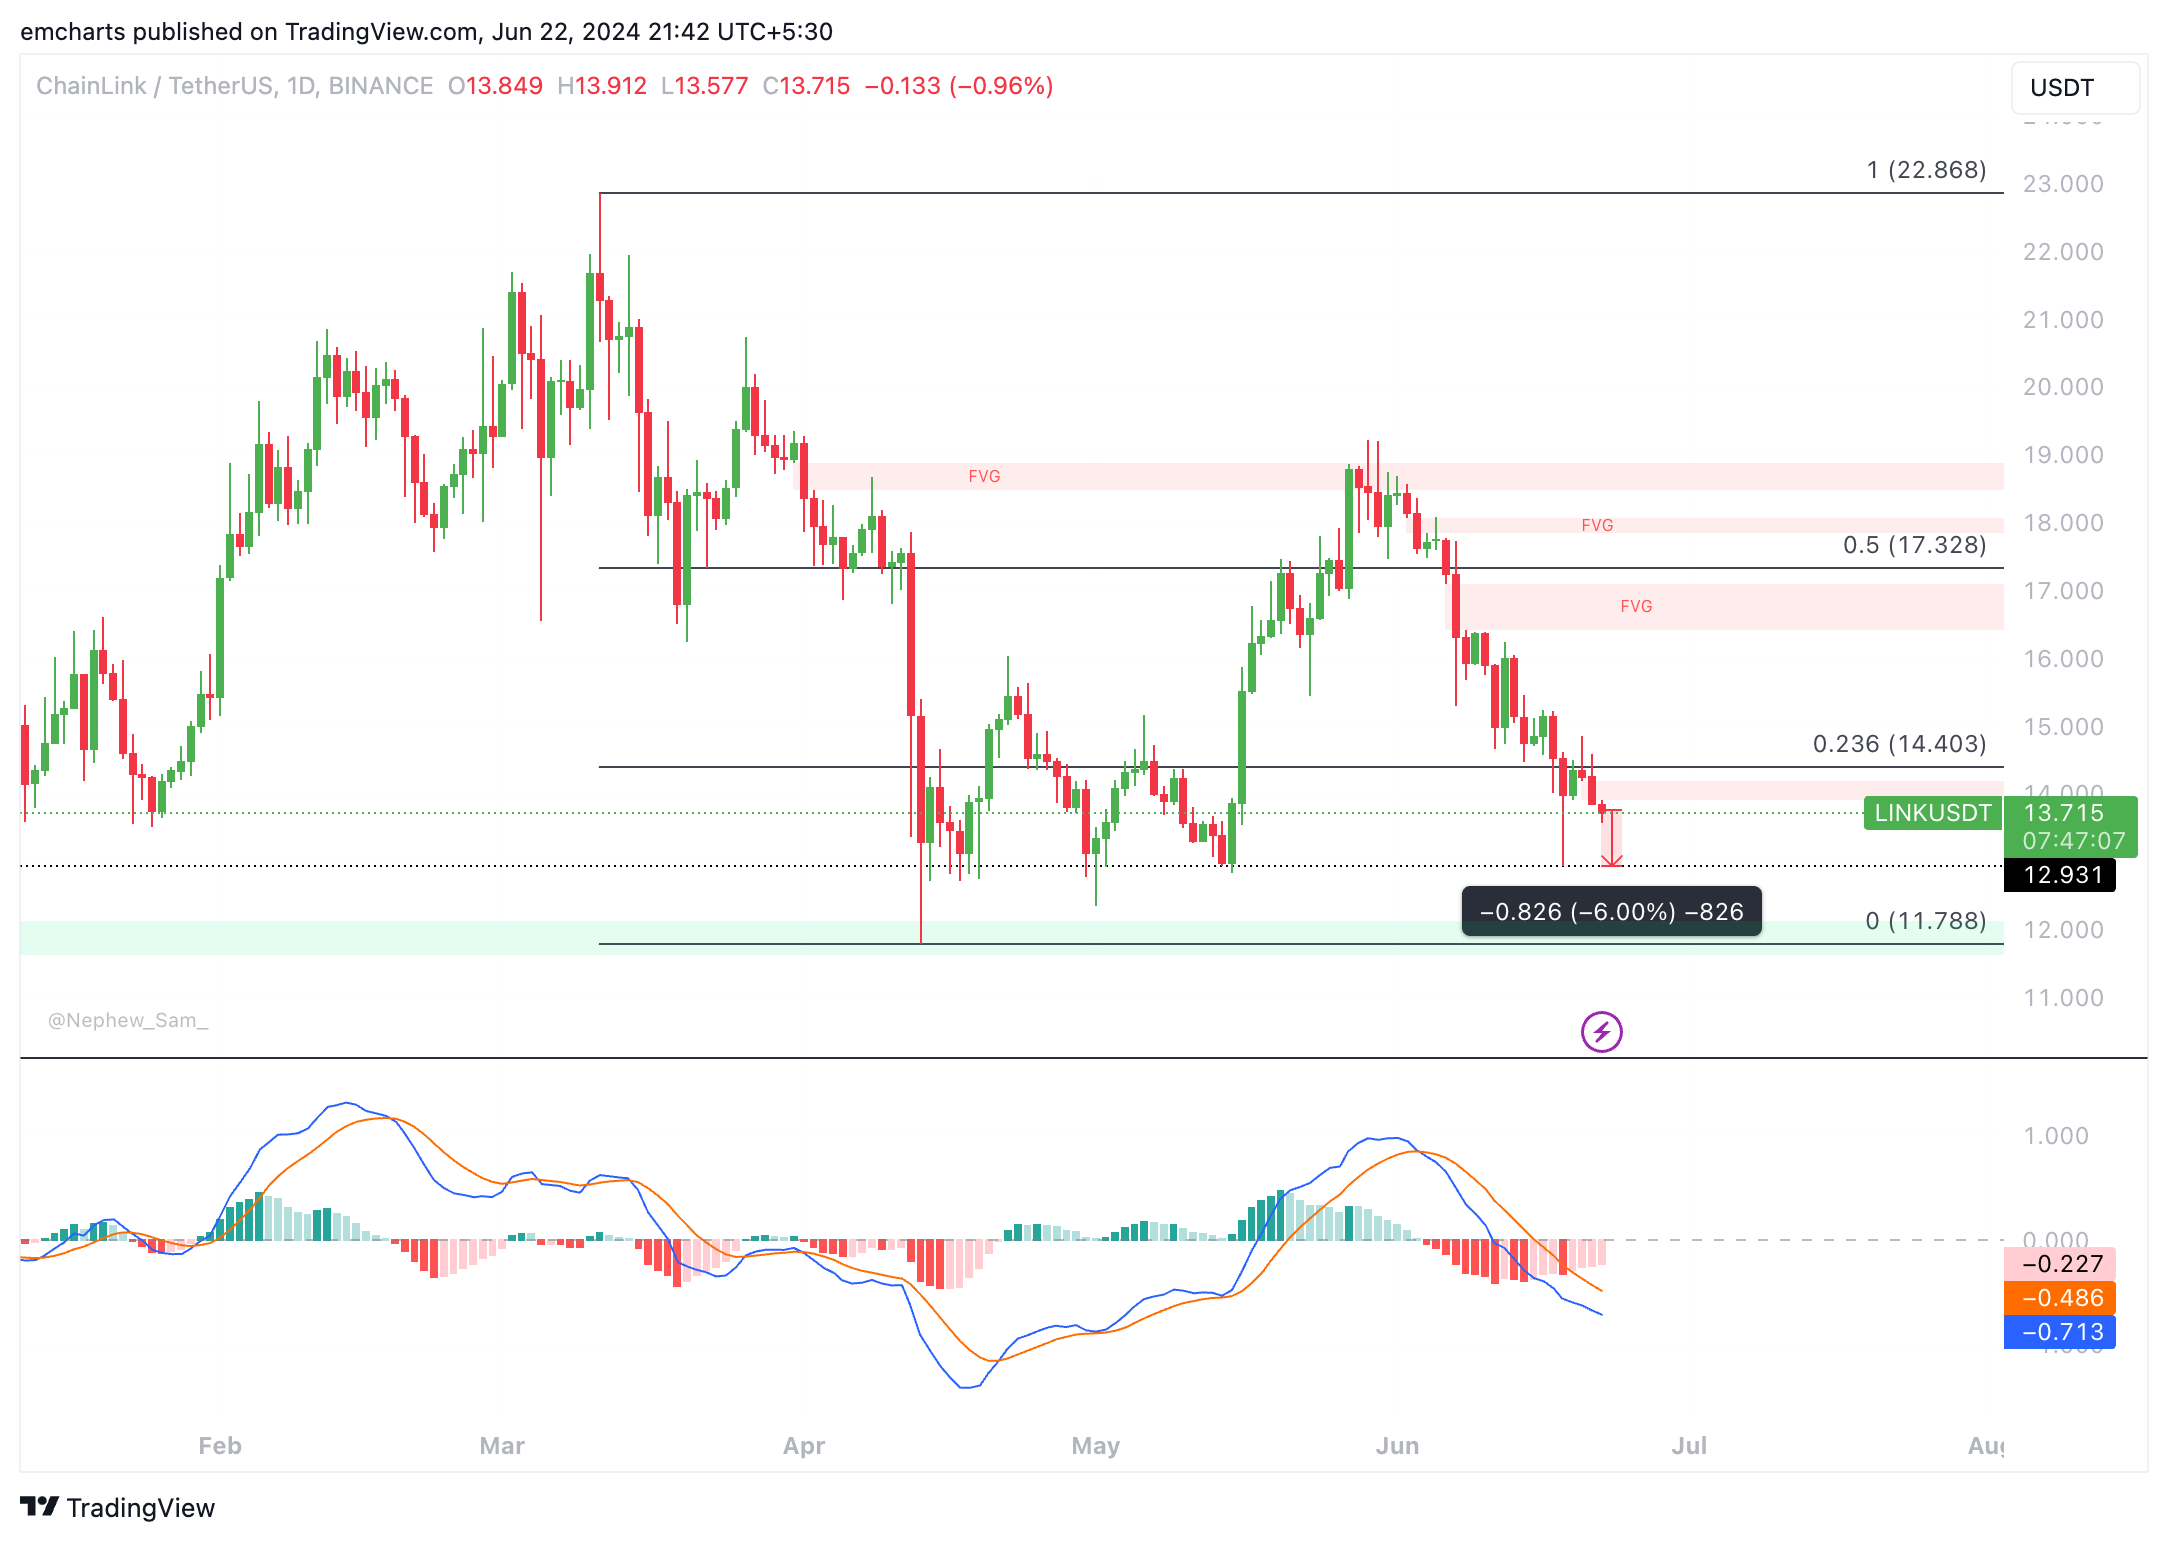
LINK/USDT 1-day chart
A daily candlestick close above $14.192 could invalidate the bearish thesis. Chainlink could target $14.403, the 23.6% Fibonacci retracement level of the decline between the March 11 high of $22.868 and the April 13 low of $11.788.