Today’s intraday V-Spike Reversal gives us a chance to study the set-up to trade an intraday reversal and not get trapped on the wrong side of a rapid movement.
Let’s highlight the pattern and pinpoint the higher timeframe support level from which it logically developed:
A large gap-down often suggests the early development of a Trend Day.
However, it’s important to take higher timeframe levels – especially key price targets – into consideration before joining into the trending action.
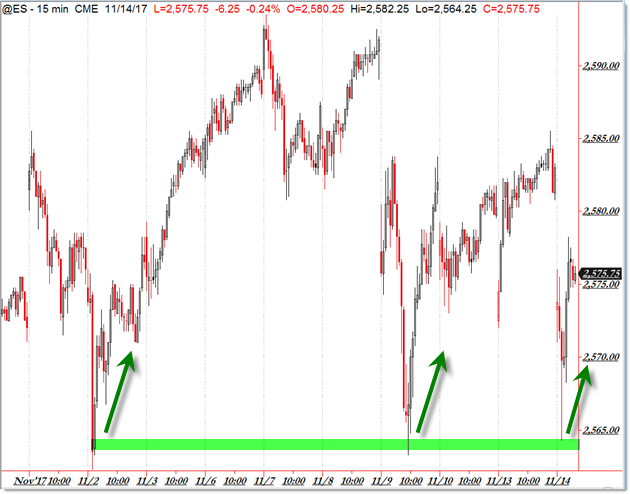
Yes, price gave a valid short-sell bear flag opportunity on the first pullback but price achieved its downside support target as seen on the intraday chart:

The 2,565 level was a “Double Bottom” price level from which buyers intervened and rallied the market higher on two occasions – November 2 and 9.
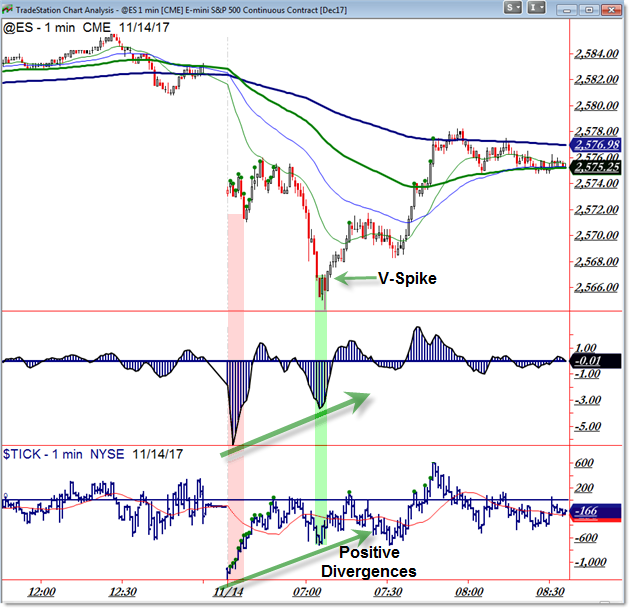
With the downside objective achieved, we turn our attention to the real time data from Market Internals (TICK) and Momentum.
As we can see in the first chart, BOTH metrics formed an obvious/visual Positive Divergence at the higher timeframe target.
Once again, buyers intervened today, thrusting the market higher and giving bulls another chance to profit from a “BUY THE DIP” scenario.
Bears… they didn’t fend as well if they missed seeing the support level and missed the positive divergence as it occurred in real time.
Keep studying this event and apply what you learn to future scenarios like this.
Follow along with members of the Afraid to Trade Premium Membership for real-time updates and additional trade planning.
Corey Rosenbloom, CMT
Follow Corey on Twitter: http://twitter.com/afraidtotrade
Corey’s book The Complete Trading Course (Wiley Finance) is now available along with the newly released Profiting from the Life Cycle of a Stock Trend presentation (also from Wiley).”


