
Brent, WTI Oil News and Analysis
- Geopolitical uncertainty and supply concerns have propped up oil
- Oil prices settle ahead of technical area of confluence resistance
- WTI respects major long-term level but geopolitical uncertainty remains
- The analysis in this article makes use of chart patterns and key support and resistance levels. For more information visit our comprehensive education library
Recommended by Richard Snow
Get Your Free Oil Forecast
External Factors have Propped up the Oil Market
Oil prices gathered upward momentum on the back of reports of outages at Libya’s main oilfields – a major source of income for the internationally recognized government in Tripoli. The oilfields in the east of the country are said to be under the influence of Libyan military leader Khalifa Haftar who opposes the Tripoli government. According to Reuters, the Libyan government led by Prime Minister Abdulhamid al-Dbeibah is yet to confirm any disruptions, but clearly the threat of impacted oilfields has filtered into the market to buoy oil prices.
Such uncertainty around international oil supply has been further aided by the continuing situation in the Middle East where Israel and Iran-backed Hezbollah have launched missiles at one another. According to Reuters, a top US general said on Monday that the danger of broader war has subsided somewhat but the lingering threat of an Iran strike on Israel remains a possibility. As such, oil markets have been on edge which has been witnessed in the sharp rise in the oil price.
Oil Prices Settle Ahead of Technical Area of Confluence Resistance
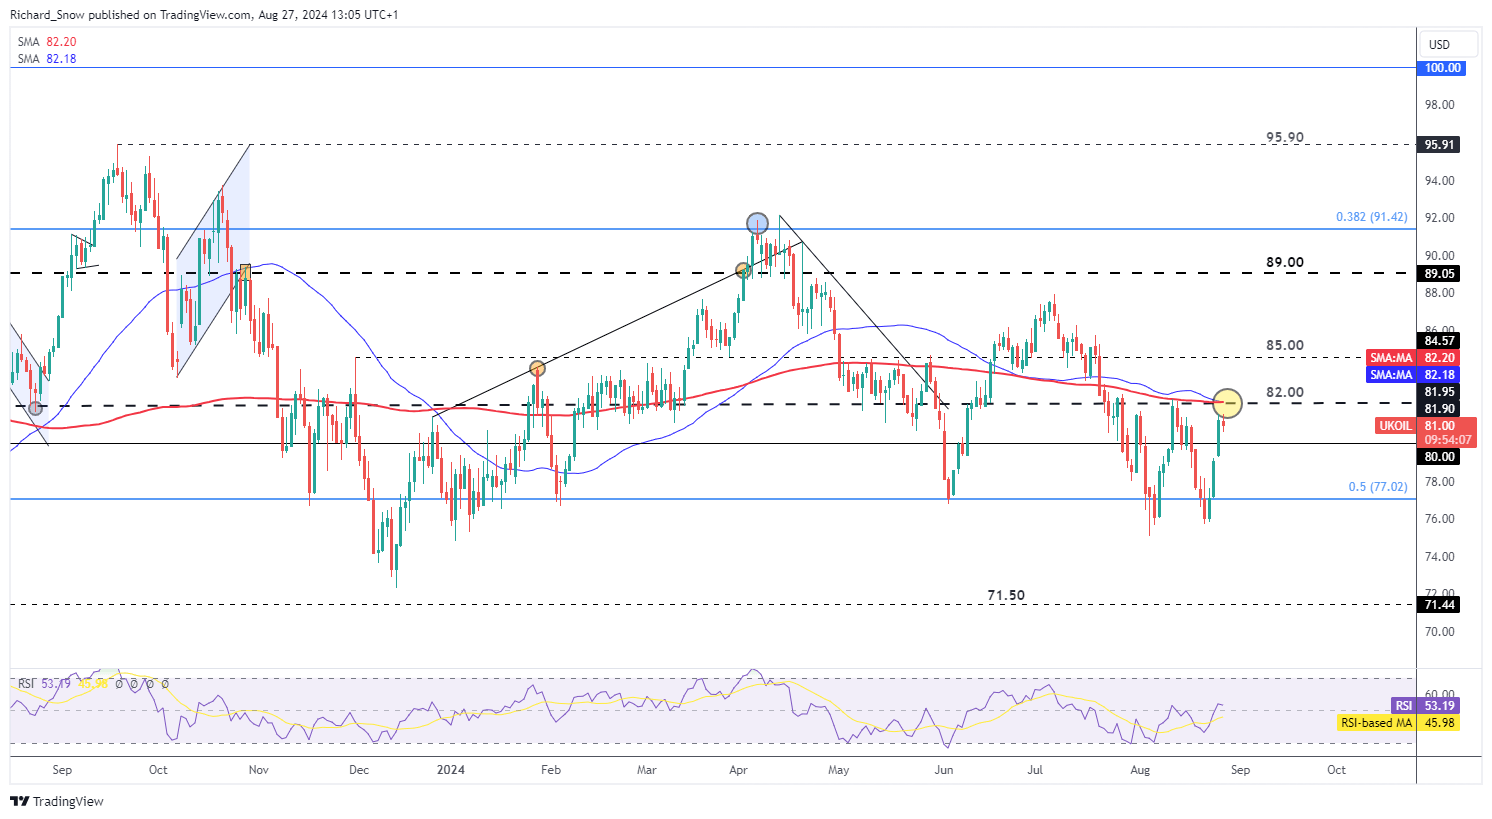
Oil bulls have enjoyed the recent leg higher, riding price action from $75.70 a barrel to $81.56. External factors such as supply concerns in Libya and the threat of escalations in the Middle East provided a catalyst for lowly oil prices.
However, today’s price action points to a potential slowdown in upside momentum, as the commodity has fallen short of the $82 mark – the prior swing high of $82.35 earlier this month. Oil has been on a broader downward trend as global economic prospects remain constrained and estimates of oil demand growth have been revised lower as a result.
$82.00 remains key to a bullish continuation, especially given the fact it coincides with both the 50 and 200-day simple moving averages – providing confluence resistance. In the event bulls can sustain the bullish move, $85 becomes the next level of resistance. Support remains at $77.00 with the RSI providing no particular assistance as it trades around middle ground (approaching neither overbought or oversold territory).
Brent Crude Oil Daily Chart
Source: TradingView, prepared by Richard Snow
Recommended by Richard Snow
How to Trade Oil
WTI crude oil trades in a similar fashion to Brent, rising over the three previous trading sessions, only to slow down today, thus far. Resistance appears at the significant long-term level of $77.40 which can be seen below. It acted as major support in 2011 and 2013, and a major pivot point in 2018.
WTI Oil Monthly Chart
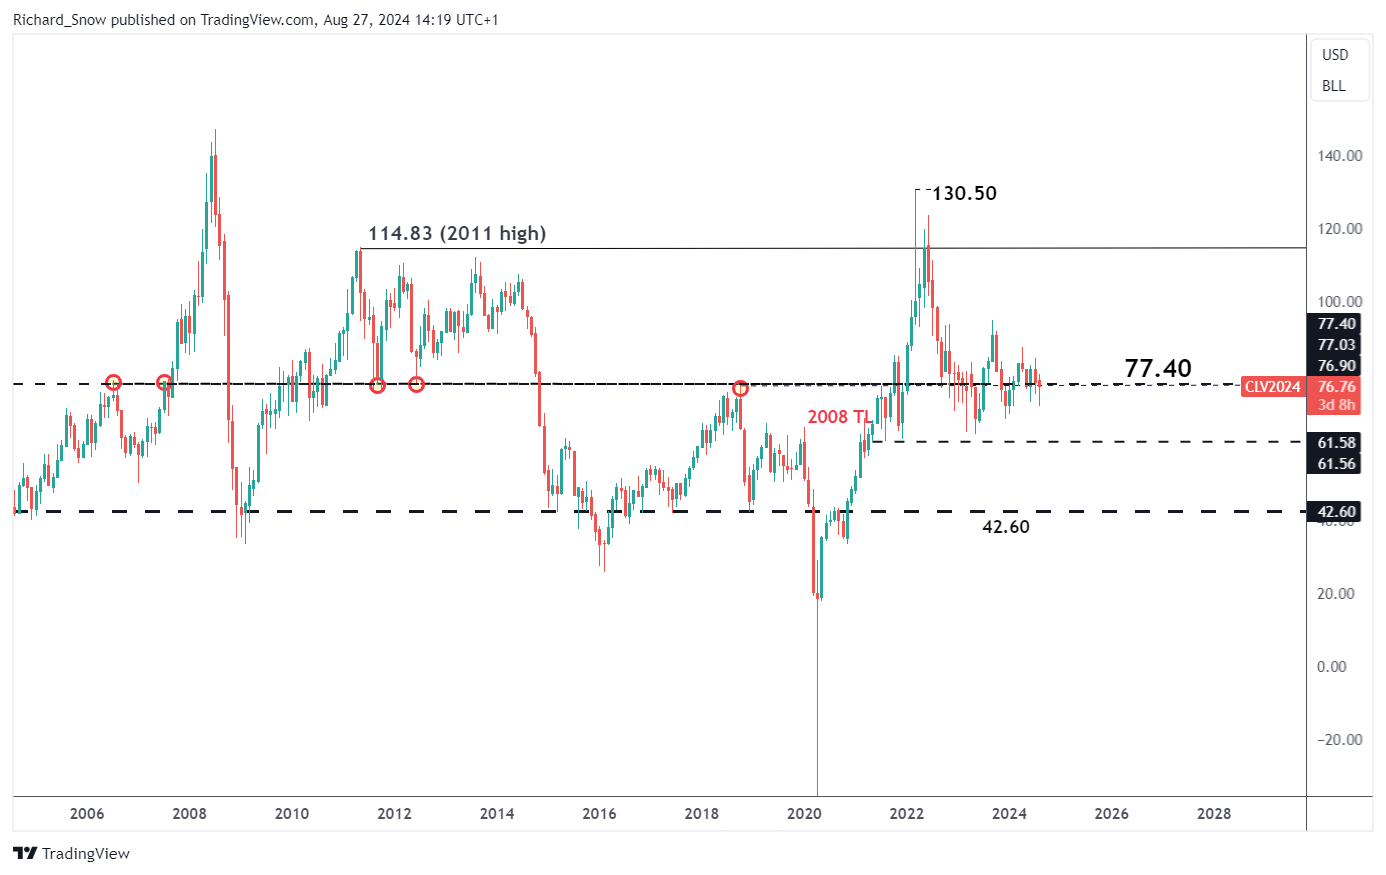
Source: TradingView, prepared by Richard Snow
Immediate resistance remains at $77.40, followed by the November and December 2023 highs around $79.77 which have also kept bulls at bay more recently. Support lies at $72.50.
WTI Oil Continuous Futures (CL1!) Daily Chart
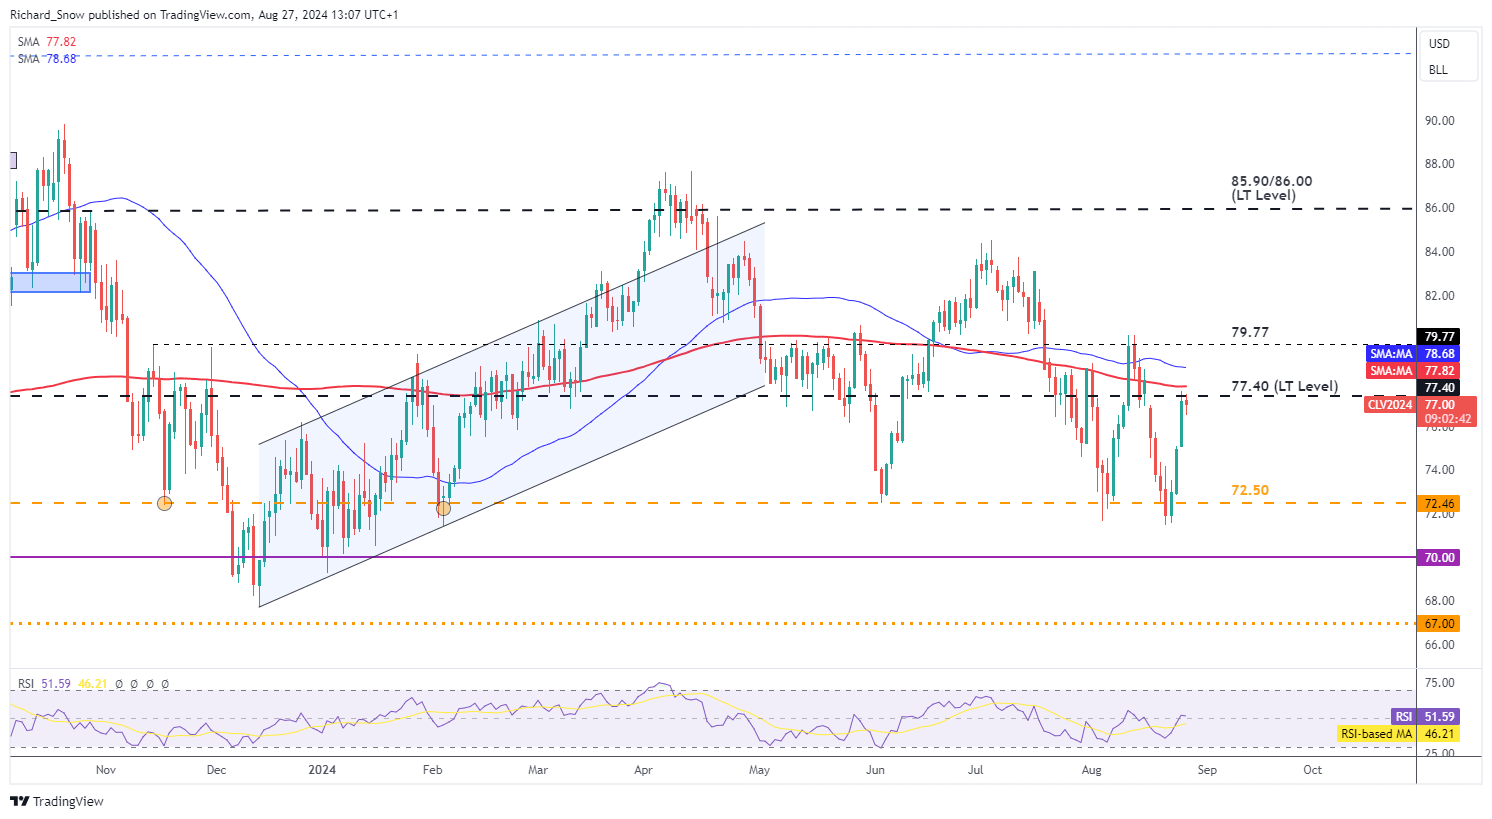
Source: TradingView, prepared by Richard Snow
— Written by Richard Snow for DailyFX.com
Contact and follow Richard on Twitter: @RichardSnowFX


