“Davidson” submits:
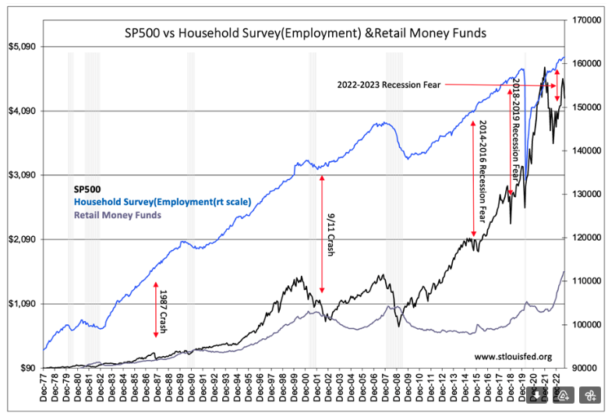
If employment is rising, then nothing is broken. There are many ways analysts describe the behavior of markets. The simplest are not complicated and describe long-term (not short-term) relationships. This chart brings together the SP500, employment and Retail Money Fund levels. It is instructive of the current environment.
Retail Money Funds are at record levels, ~$1.6Trillion. The highest level in history. The patterns of the three data series spell out much about how markets work. Most of the current discussion concerns the direction of stocks and the impact on the economy. But, looking closely at this history from 1977-Today, it should be clear that the employment trend leads stock prices, not the other way around. It should also be clear that once equity prices begin to fall, Retail Money Funds rise as individual investors exit stocks and seek safety. The pattern is employment leads, stocks follow and retail investors follow stock prices. If the media is negative, then equities decline and money funds rise and vice versa if the media is positive. This leaves equities and money funds driven by market psychology. Employment is an economic supply/demand indicator and powers through periods of pessimism leading equity prices higher or lower depending on the demand.
At present, economic demand is trending higher but pessimism continues to buck this trend. The economic trend is our friend and provides a decent early warning. As long as employment continues to rise, nothing is broken with the economy and equities should follow. The current pessimism of individual investors is a signal of higher equity prices ahead in my opinion.


