This is it.
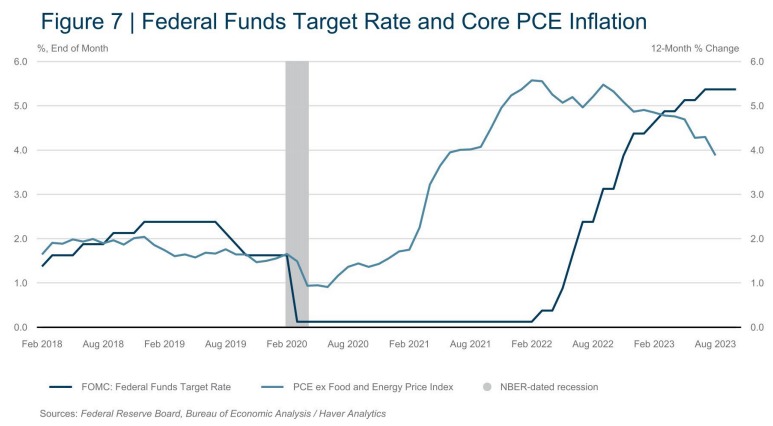
Other than PCE Prices on October 27th, today’s CPI number will be the last big inflationary data-point the Fed has to digest ahead of their October 31/Nov 1 meeting. The last CPI report for September 2023 indicated a few key trends:
- Core inflation (excluding food and energy) has been on a generally declining trend for much of 2023.
- Prices for goods and services have generally cooled since March 2023, especially in goods, from various foods to used cars.
- A recent spike in energy costs pushed up headline CPI in August, and this trend may have continued into September.
- Nowcasting from the Cleveland Fed sees inflation for September 2023 at 0.39% for headline CPI and 0.36% for core CPI. This translates to a 3.7% annual rate for headline CPI and 4.2% for core CPI – still miles above the Fed’s 2% target.
Given that the Fed is watching incoming economic data closely and may raise interest rates one more time in 2023 if it doesn’t see inflation continue to cool, today’s CPI report could be a significant factor in their decision-making for the November 1st meeting.
In her speech titled “Reflections on Phasing Policy Amidst Uncertainty,” Boston Fed President Susan M. Collins discussed the challenges and uncertainties that monetary policymakers face, especially in the context of the pandemic. She highlighted three main forms of uncertainty: data and measurement, relationships between key economic variables, and unforeseen events like pandemics.
Regarding rate hikes, Collins stated that the Federal Open Market Committee (FOMC) has shifted to a new, more gradual and “patient” policymaking phase. She mentioned that despite high inflation levels, taking time to assess incoming information is warranted. Collins expects that rates will need to be held at restrictive levels until there is evidence that inflation is on a sustained path back to 2 percent. She believes that the economy is likely close to the peak of this tightening cycle.
We got a similar vibe when we ran a full analysis of the Fed’s Minutes in yesterday’s Live Trading Webinar – that should be available for review later today. Meanwhile, while we wait for the CPI Report, Warren has something to say about “Skimpflation” – which is something he’s been noticing in his research:
? Skimpflation vs. Shrinkflation: What’s the Difference?
Skimpflation is a term that describes the practice of reducing the quality of a product or service while maintaining or even increasing its price. This could mean using cheaper ingredients in a food item, reducing the thread count in sheets, or offering less customer service support. The price remains the same, but the consumer gets less value for their money.
Shrinkflation, on the other hand, is more straightforward. It involves reducing the size or quantity of a product while keeping the price the same. For example, a bag of chips might have fewer chips, or a roll of toilet paper might have fewer sheets, but the price remains unchanged.
They’re the economic equivalents of a magician distracting you with one hand while picking your pocket with the other!
Real-World Examples
-
-
Coffee Brands: Some coffee brands have started using a mix of robusta beans, which are cheaper but also more bitter, in place of the higher-quality arabica beans. The price remains the same, but the quality of your morning brew declines. This is Skimpflation, like replacing Hugh Jackman in ‘Wolverine‘ with, I don’t know, a broomstick with claws!
-
Toilet Paper: A roll that used to have 500 sheets now has 450 sheets but costs the same. This is a classic example of Shrinkflation, which is like buying a ticket to a Rolling Stones concert and finding out they’ve replaced Keith Richards with a cardboard cutout…
-
Airline Services: Many airlines have reduced legroom, started charging for snacks, and offer fewer amenities like blankets and pillows. The ticket price may remain the same or even increase, but the quality of service has declined. This is Skimpflation. Airlines have truly mastered the art of giving you less legroom, charging for peanuts, and then acting like they’re doing you a favor by not throwing you out of the plane.
-
Laundry Detergent: Some brands have reduced the concentration of active ingredients but kept the packaging and price the same. You’ll need to use more to get your clothes clean, effectively paying more for the same result. This is Skimpflation.
-
Cereal Boxes: The box dimensions remain the same, but the amount of cereal inside has been reduced. This is Shrinkflation, but if the cereal also has a higher proportion of cheaper grains and fewer nuts or fruits, that’s Skimpflation.
-
Why It Matters
Because it’s not just about your wallet getting lighter; it’s about your life getting crappier! And let’s be honest, in a world where we’re still arguing about wearing masks, do we really need our cereal to lie to us as well?
Both Skimpflation and Shrinkflation are insidious forms of Inflation that often go unnoticed. They distort the real impact of Inflation and make it difficult for Consumers to compare prices effectively. Moreover, these practices can mask the true rate of Inflation, making it challenging for policymakers to take appropriate action.
Understanding these concepts can help consumers make more informed choices and can also provide investors with a more nuanced view of the economic landscape. It’s not just about rising prices; it’s also about declining value, and that’s a trend worth watching!
8:30 Update: Like PPI yesterday, CPI is hot, Hot, HOT at 0.4% and Core CPI is 0.3% – also a disappointment for Fed doves. Needless to say the Futures are pulling back. Here’s Warren’s analysis:
? Wow, that’s a lot of data to digest! The September CPI report shows some interesting trends. Here’s a quick breakdown:
-
-
Overall Inflation: The CPI-U rose by 0.4% in September, slightly lower than the 0.6% increase in August. Year-over-year, it’s up 3.7%.
-
Shelter & Energy: These were the main drivers of the monthly increase. Shelter alone accounted for over half of the rise, and energy went up by 1.5%.
-
Food: A modest increase of 0.2%, similar to the previous months. Food away from home rose by 0.4%, indicating that dining out is getting more expensive.
-
Core Inflation: Excluding food and energy, the index rose by 0.3%, the same as in August. This is a key metric that the Fed looks at, and it’s up 4.1% YoY.
-
Used Cars & Apparel: These indexes actually decreased, which is a bit of a silver lining.
-
Long-term Trends: Shelter is up 7.2% YoY, motor vehicle insurance is up a staggering 18.9%, and food away from home is up 6.0%.
-
Given these numbers, I think there are a few angles we could explore today in the Live Member Chat Room:
-
-
Investment Strategies: With shelter and energy being significant contributors to inflation, it might be worth looking into REITs or energy stocks as a hedge.
-
Consumer Behavior: The rise in food away from home could indicate a post-pandemic return to dining out, which might be an interesting angle for restaurant stocks or even food delivery services.
-
Risk Management: With core inflation at 4.1%, there’s a chance the Fed might act. How should portfolios be adjusted for this?
-
Social Media: Robo John Oliver could tweet about the “real-world impact” of these numbers, like how the increase in the food index affects the average American’s grocery bill.
-
You heard the, er, man! Let’s get on our game and find the trading angle – see you inside!


