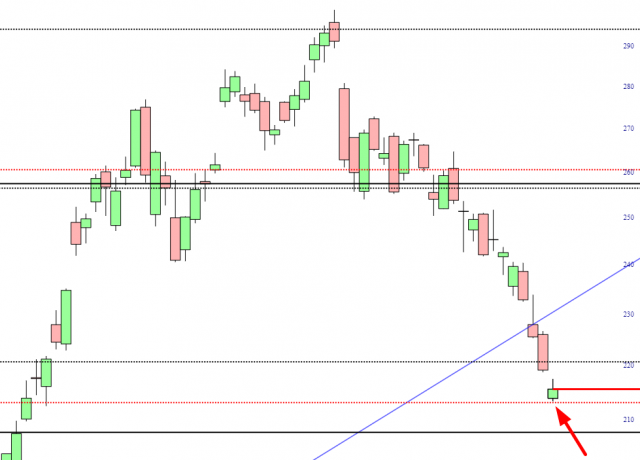
The stock chart of TSLA has been behaving itself quite predictably lately. The company has lost a quarter of its value in a matter of weeks, and after it pierced its supporting trendline (in blue, below) it was up to the Fibonacci retracements to hold the sucker up. The highest Fib failed yesterday, and the middle Fib has done a yeoman’s job keeping prices up (note the low of the day perfectly coincided with the value).
I have not had, nor do I intend to have, any position in this, but if I may offer a wild guess as to what’s next, I’d say that it’ll probably bounce toward the underbelly of that broken trendline, re-weaken, and then have another go at those Fib levels. I think the red arrow is a strong possibility. Less likely, but God help it if it happens, is the failure of the lowest Fib, which will lead to a sell-off of unknown depth.

Tesla in Days Ahead


