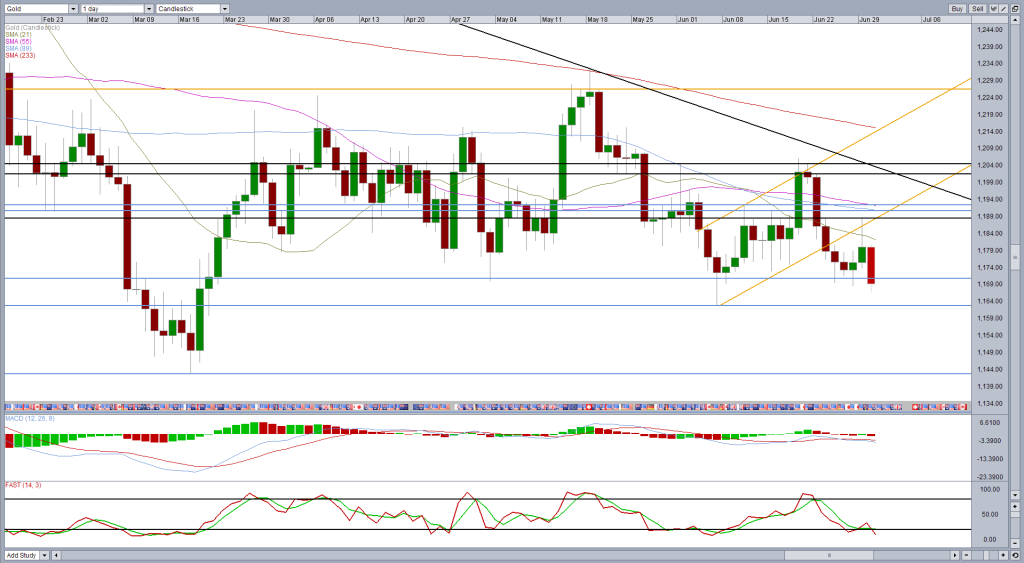
Gold may have got a boost at the start of the week from the Greek turmoil, benefiting greatly from its safe haven status, but it continues to look heavy from a technical standpoint.

There remains a couple of key support levels in this being $1,170 and $1,162.79. The former has been a solid support for some time now and has only been significantly broken once and even then, it rebounded to end the day above.
Once again the level is coming under significant pressure and if it is broken, we could see quite a bearish move to the downside. The latter – $1,162.79 – may offer some support along the way being the most recent support level, but this doesn’t generally have a history of being such a key level.
The failure to break back above $1,188 on Monday is quite a bearish signal as it’s not only the first clear resistance level for the yellow metal, it’s also pretty much in line with the bottom of the ascending channel/flag that it broke below. This failure acts as confirmation of the bearish move.

Adding to this bearish outlook is the bearish engulfing pattern which formed on the weekly chart. Combined, all of these signals create a strong bearish case for Gold.
If we see a close below $1,170 today, it could further confirm the bearish move, with the next major support coming around $1,142.73 – 17 March lows – with $1,131.50 being the next significant support below here – 7 November lows.
It’s worth noting that the oscillators are showing no signs of momentum loss which may suggest that the level is going to be put under intense pressure.
If we view the move from 18 May highs as a flag formation, the break could give us a conservative and aggressive price projection based on the size of the flag.
The conservative projection comes from the size of the move from the top of the pole to the entry of the flag – around $47.60 – and gives a projection of around $1,132.13 from the breakout point. This pretty much coincides with the second key support level, mentioned above.
The more aggressive projection comes from the size of the move from the top of the pole to the bottom – around $69.74 – and gives a projection of around $1,110. This roughly coincides with 23 April 2010 lows.
As always, these projections should not be set in stone and are just derived from past performance of these kinds of setups.
SOURCE: MarketPulse – Read entire story here.
