Some macro textbooks (not all) are a bit like extensively modified code. You can see the structure of the original code, even after extensive software development. This can mean that, as new capabilities were added to the programme, rather than rewrite the software from scratch, extra routines were just added on top. Not only is this inefficient, but the whole thing ends up looking like a confused mess.
Perhaps this is why we end up with textbooks that still have the completely out of date LM curve at their heart (and associated AD curves, plus Mundell Fleming, and even money multipliers), but additional chapters where the AS curve becomes a Phillips curve, and money targeting gives way to Taylor rules. The student ends up totally confused, if they ever get to those later chapters. And after the financial crisis, a new edition will have a chapter devoted to that crisis, but not much in earlier chapters will change.
This is not the case with the third textbook by Wendy Carlin and David Soskice. It has been around for a few months, but I at last got a chance to take a good look.
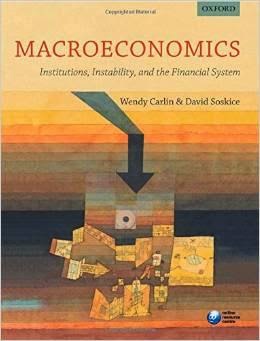
I say third textbook rather than third edition because they do not do editions. This is a complete rewrite of their earlier ‘Macroeconomics: Imperfections, Institutions, and Policies’. Luckily all the features of that earlier book that I really liked are retained. For example, a supply side based on imperfect competition rather than perfect competition (although alas the price setting curve is still flat!). But most importantly, a core model (the 3 equation model) which dispenses with the LM curve, and replaces it with a ‘monetary rule’ curve, based on a central bank using interest rates to hit an inflation target. This is similar to the approach championed by David Romer. (So the 3 equations are the IS curve, the Phillips curve, and the monetary rule curve.)
There are also some major improvements compared to the second book. The open economy analysis is now fully integrated with the 3 equation model, and the remnants of Mundell-Fleming are gone. The Euler equation appears on page 22, as one of the foundations of the IS curve. It is a shame that the Phillips curve is still based on the traditional (this period’s expected inflation) rather than New Keynesian (next period’s expected inflation) version, but you cannot have everything.
But by far the most important change concerns the financial sector. After initial chapters on the demand side, supply side and 3 equation model, plus a fourth on expectations, we have three chapters on the financial sector. The first looks at the banking sector, and makes the key alteration to the 3 equation model: there is a wedge between the ‘policy’ interest rate and the interest rate relevant for the IS curve. You can see this chapter as looking at how the financial system works in ‘normal’ times, when the system is not a source of instability. The second chapter then looks at how the financial system can be a source of instability, through mechanisms like the financial accelerator or asset price bubbles. The third chapter applies this analysis to the financial crisis of 2008.
When I taught most of the finals macro course at Oxford, I used their earlier book. I did have a lecture on the financial crisis, but it was an add-on of the type I described above. This new book is almost enough to make me wish I was still teaching this course. It gives finance the position in macro that recent events suggest it deserves. Mark Gertler on the back cover writes: “This is an exciting new textbook. Overall, it confirms my belief that macroeconomics is alive and well”. That pretty well sums up my reaction.
Except to add that the front cover is a painting by Paul Klee. Perfect!
SOURCE: mainly macro – Read entire story here.